Predicting fuel economy from ~40,700 vehicles
Three regression models, one dataset, one question: which learns vehicle fuel economy best? Random Forest delivered the strongest results, R² = 0.9366 across roughly 40,700 EPA vehicle records, in a co-authored poster at Innovation Day.
- Python
- scikit-learn
- pandas
- NumPy
- Statistics
40,000+
Vehicle records
EPA fuel economy data, 1984 to 2019
3
Models compared
Random Forest · KNN · SVR
0.9366
Best R² (Random Forest)
Evaluated with R² · RMSE · MAE
POSTER
Co-authored & presented
UTA Innovation Day, April 14, 2026
DATA
40,000+ EPA vehicle records
PREP
Cleaning · feature engineering
SPLIT
Train / test partition
MODEL
Random Forest
R² 0.9366
Strongest on all metrics
MODEL
KNN
Compared
R² · RMSE · MAE
MODEL
SVR
Compared
R² · RMSE · MAE
RESULT
Random Forest wins: R² = 0.9366
Evaluated with R², RMSE, and MAE. Co-authored poster presented at UTA College of Engineering Innovation Day.
R² · RMSE · MAE
RF BEST
Context
One dataset, three models, one question
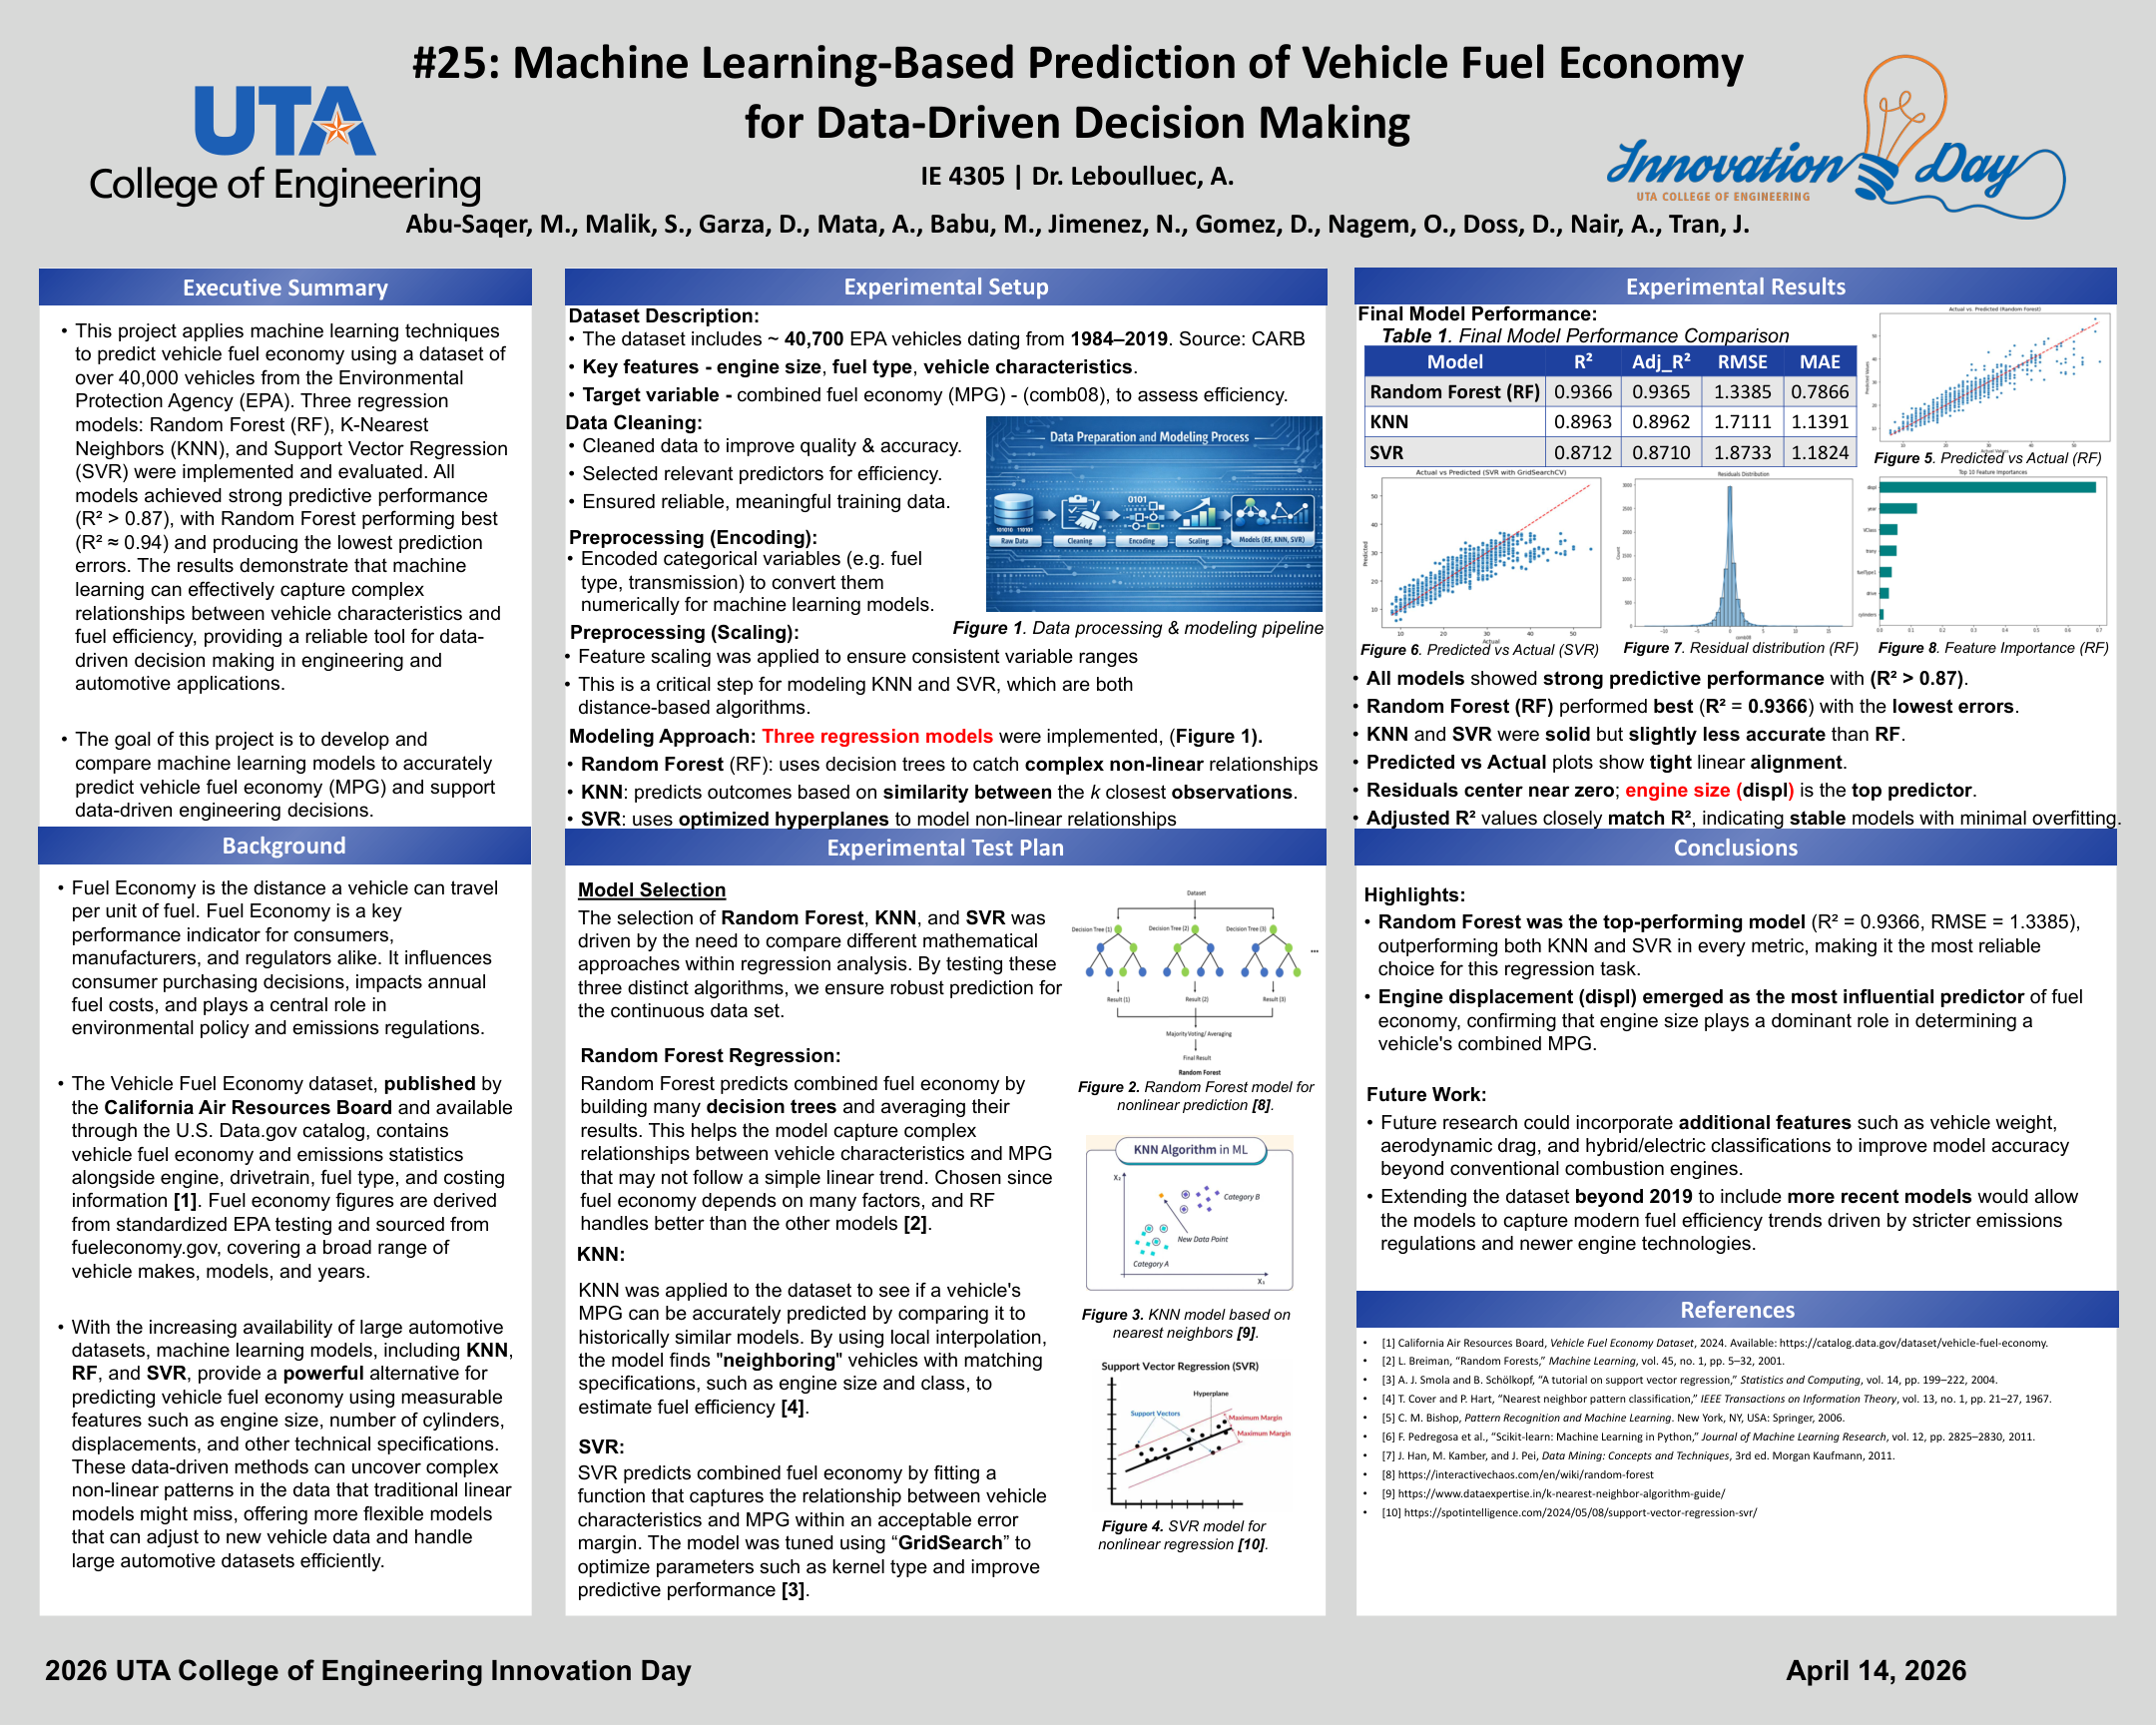
We set out to predict vehicle fuel economy from roughly 40,700 vehicles, model years 1984 to 2019. The dataset is published by the California Air Resources Board through the U.S. Data.gov catalog, and the fuel economy figures come from standardized EPA testing. The target was the EPA's combined rating, comb08. The question wasn't academic: fuel economy predictions feed decisions in fleet management, policy, and consumer research. And the dataset is exactly the kind of messy, real-world data that separates useful models from overfitted ones.
Problem
Which approach actually learns this data best?
Three very different regression families were on the table: a tree ensemble (Random Forest), an instance-based method (K-Nearest Neighbors), and a kernel method (Support Vector Regression). Each has different assumptions about noise, feature interactions, and scaling. The team's job was to clean the data, train all three fairly, and compare them on standard metrics, not to make one of them win.
Role
Data prep, modeling, evaluation, and the poster
I helped clean and prepare the roughly 40,700 records, handling missing values, encoding categorical features like fuel type and transmission, and scaling the data so distance-based models like KNN and SVR stayed stable. I built the train/test split so every model faced the same data, trained and evaluated all three models, tuned SVR's kernel with GridSearch, and contributed to the research poster. We judged performance on R², adjusted R², RMSE, and MAE so no single metric could hide a weakness.
Outcome
Random Forest delivered the strongest results: R² = 0.9366
Random Forest achieved an R² of 0.9366, the strongest result of the three models. Every model cleared R² above 0.87, so all three approaches learned the data well. Random Forest just learned it best: the ensemble's robustness to noisy, heterogeneous vehicle data beat both KNN and SVR, which validated our expectation that feature interactions in this dataset favored tree-based methods.
| Model | R² | Adj R² | RMSE | MAE |
|---|---|---|---|---|
| Random Forest | 0.9366 | 0.9365 | 1.3385 | 0.7866 |
| KNN | 0.8963 | 0.8962 | 1.7111 | 1.1391 |
| SVR | 0.8712 | 0.8710 | 1.8733 | 1.1824 |
Lower RMSE and MAE are better.
Engine displacement came out as the top predictor, which lines up with what you'd expect: bigger engines burn more fuel.
The full comparison went up as a research poster with eleven co-authors and was presented at the UTA College of Engineering Innovation Day on April 14, 2026.
Lessons
Evaluation is a story, not a number
A single metric can flatter a model. Using R², RMSE, and MAE together and reporting all three is what made the comparison credible. I also learned that most of the work in applied ML is data preparation and honest evaluation, and that a poster forces you to explain a model to people who haven't seen the data. That discipline carried directly into the WAAM research I'm doing now.